PRESS RELEASE: Verge Price Analysis: XVG Testing Strong Support After a Long Decline
PRESS RELEASE: Verge Price Analysis: XVG Testing Strong Support After a Long Decline
March 5, 2019
PRESS RELEASE: EY Aims to Make It Easier to Calculate Crypto Taxes With New Tool
March 5, 2019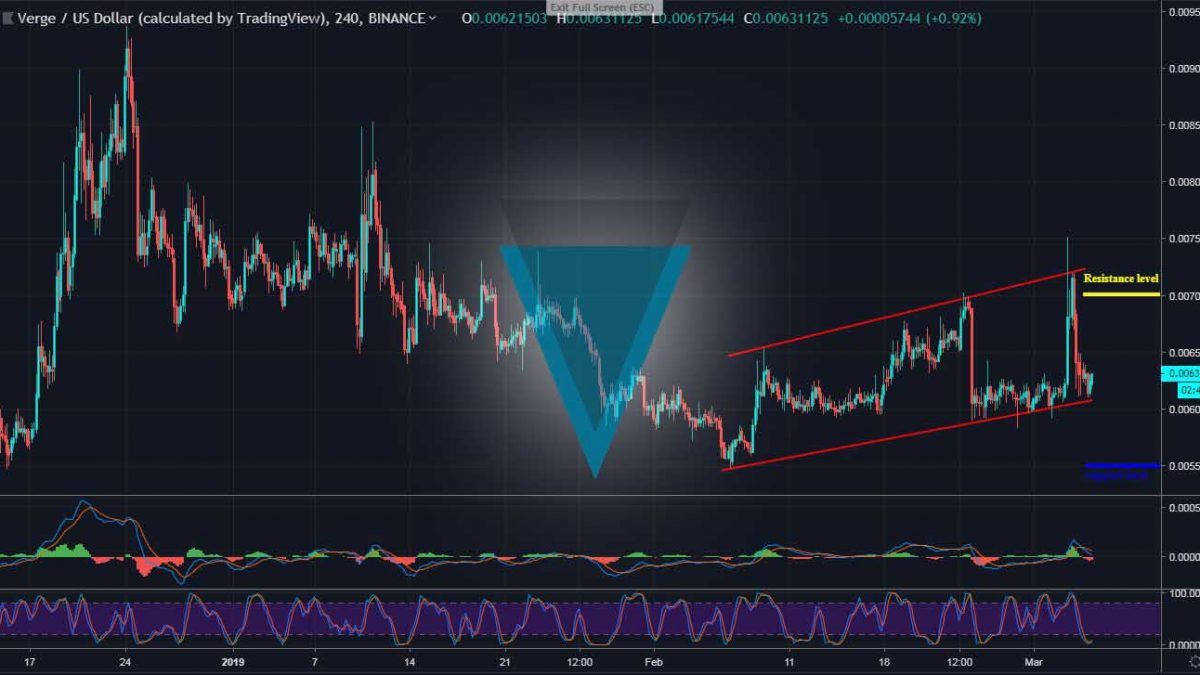
Verge (XVG) Price Analysis – March 5. Since the beginning of 2019, Verge performance has remained very low due to low trading volume in past months. Against Bitcoin, there’s no significant positive move except the Dollar pairing which saw a reversal last month. In the last 24 hours, XVG -2.25% market cap is about $93 billion with current price at $0.0062 level.
XVG/USD Market
Key
levels:
Resistance levels: $0.007, $0.0075, $0.008;
Support levels: $0.0055, $0.005, $0.0045;
Testing $0.0055 strong support after a long decline, Verge (XVG) took a reversal trending in an ascending channel pattern. The bulls are steadily coming up as a positive move is now revealing on the 4-hours MACD.
XVGUSD, 4H – March 5
Yesterday, XVG saw a heavy pull back which lasted to the lower channel. The bears are exhausted. Now, the bulls are preparing to walk up price to the upper channel. The 4-hours Stochastic RSI revealed a possible long as the token reaches the oversold condition. A bullish move is expected to visit $0.007 and $0.0075 resistance levels, atop the channel.
As
price action follows trend line, a break-down could send price
straight to $0.0055 support and beyond. In the same vein, a break is
likely to find resistance at $0.008. The 4-hours Stochastic RSI is
suggesting a surge.
XVG/BTC Market
Pairing Bitcoin , Verge is moving in a downward direction as price approaches the next support level at 150 SAT support. The bears are in play. As shown on the 4-hours Stochastic RSI, the selling pressure in nearly exhausted at oversold area. XVG is currently trading at 164 SAT price level.
XVGBTC, 4H – March 5
Above the channel, an upward movement is likely to shoot price at 210 SAT resistance level. If the scenario occurs, a bullish move is signaled. Below the channel, however, a swing low could sink price to the bottom of 140 SAT support.
At the above support, a rebound is more likely to take the token higher as the level remains a strong entry point for buyers. In case a rebound failed, XVG will experience an ‘ugly’ decline which might deflate its value in the market. By then, the 4-hours MACD would be at the lowest level.
Verge (XVG) in 2019
Wondering what can 2019 bring for XVG? For an in-depth fundamental review on what to expect for Verge in 2019 please proceed to our article “How does 2019 for Verge (XVG) Look? Fundamental Review “.
VERGE (XVG) in 2019
Like what you’re reading? Subscribe to our top stories
amzn_assoc_placement = “adunit0”;
amzn_assoc_search_bar = “true”;
amzn_assoc_tracking_id = “cryptovibes-20”;
amzn_assoc_search_bar_position = “bottom”;
amzn_assoc_ad_mode = “search”;
amzn_assoc_ad_type = “smart”;
amzn_assoc_marketplace = “amazon”;
amzn_assoc_region = “US”;
amzn_assoc_title = “Shop Related Products”;
amzn_assoc_default_search_phrase = “ledger nano s”;
amzn_assoc_default_category = “All”;
amzn_assoc_linkid = “91b4df01d5c71edac39628ca1a2aa0c4”;
The post Verge Price Analysis: XVG Testing Strong Support After a Long Decline appeared first on Cryptovibes.com – Daily Cryptocurrency News .
This is a syndicated post from https://www.cryptovibes.com/analysis/verge-xvg-price-analysis-march-5/


